

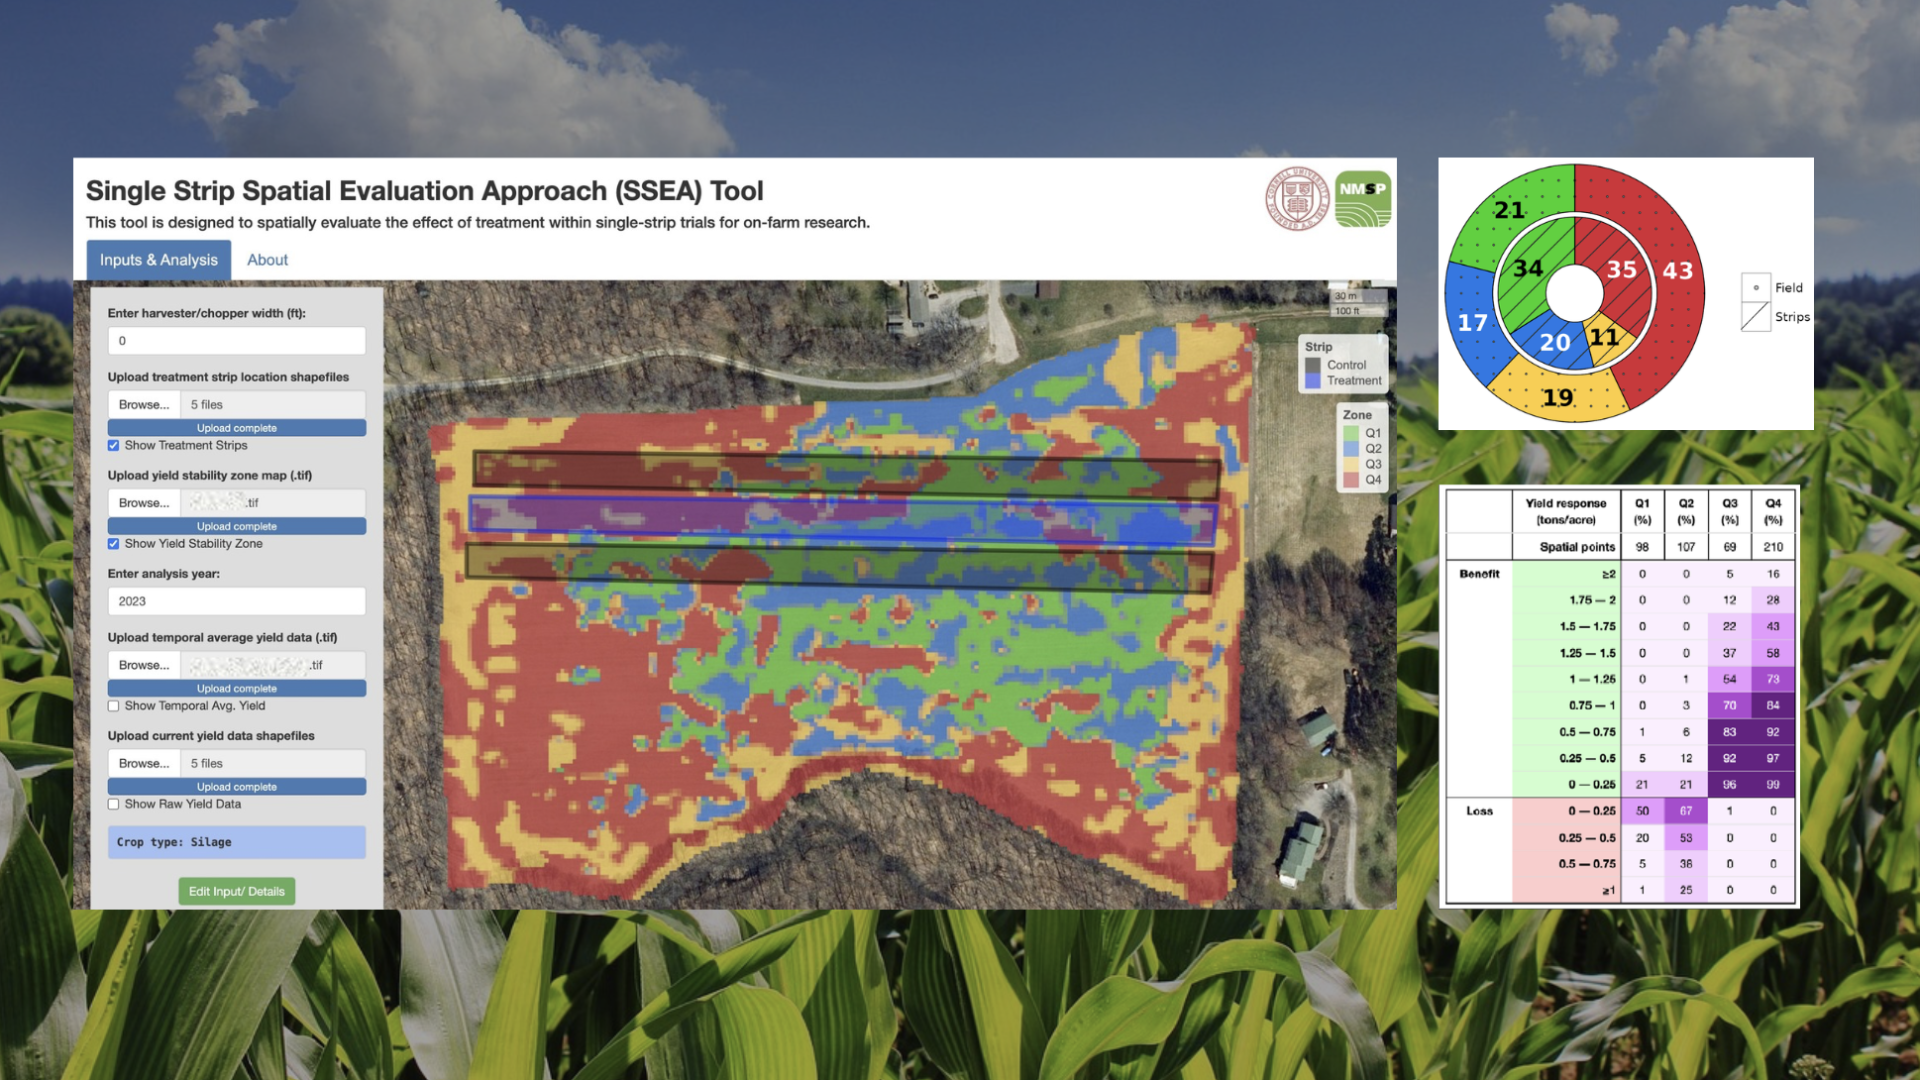
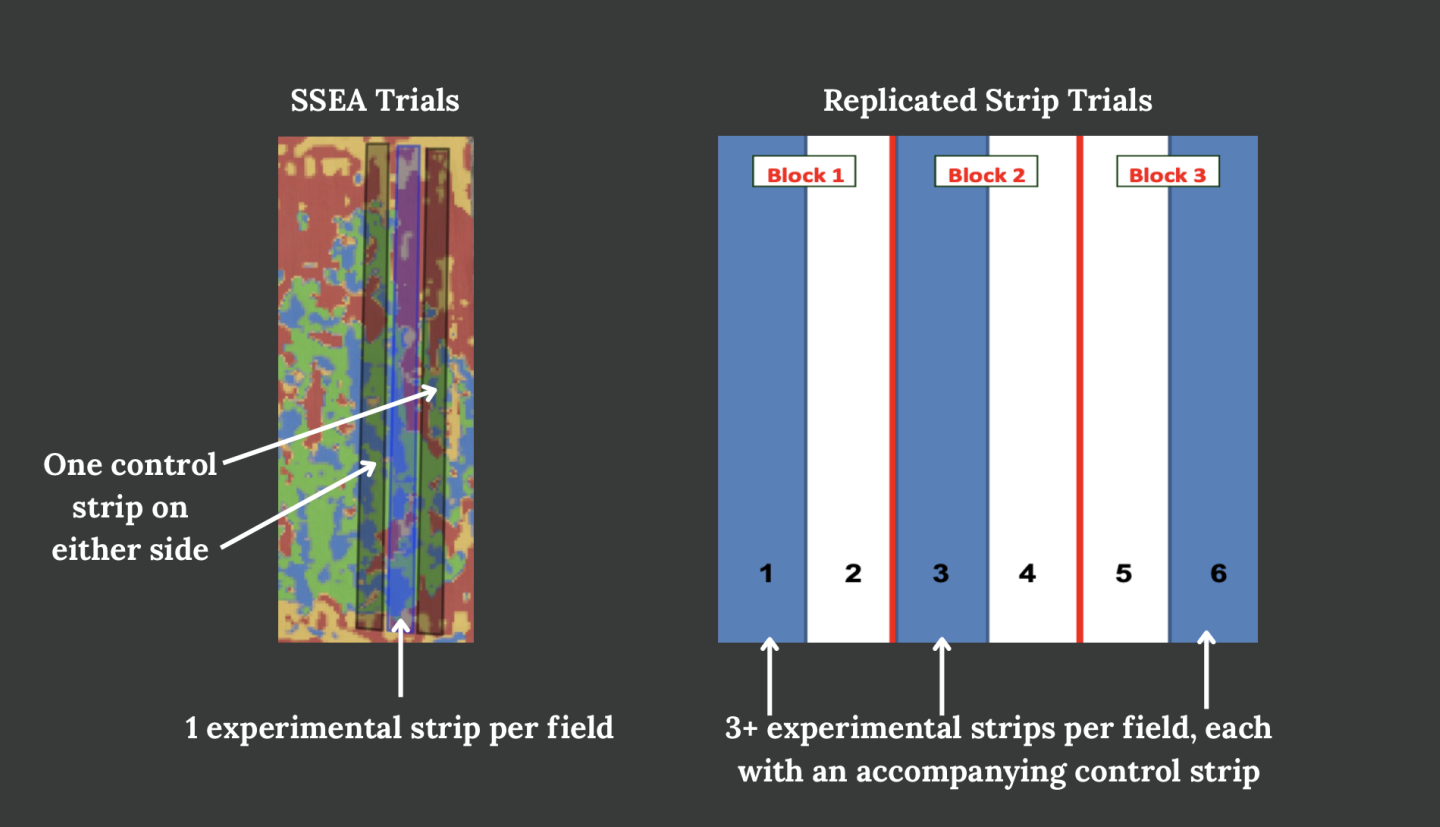
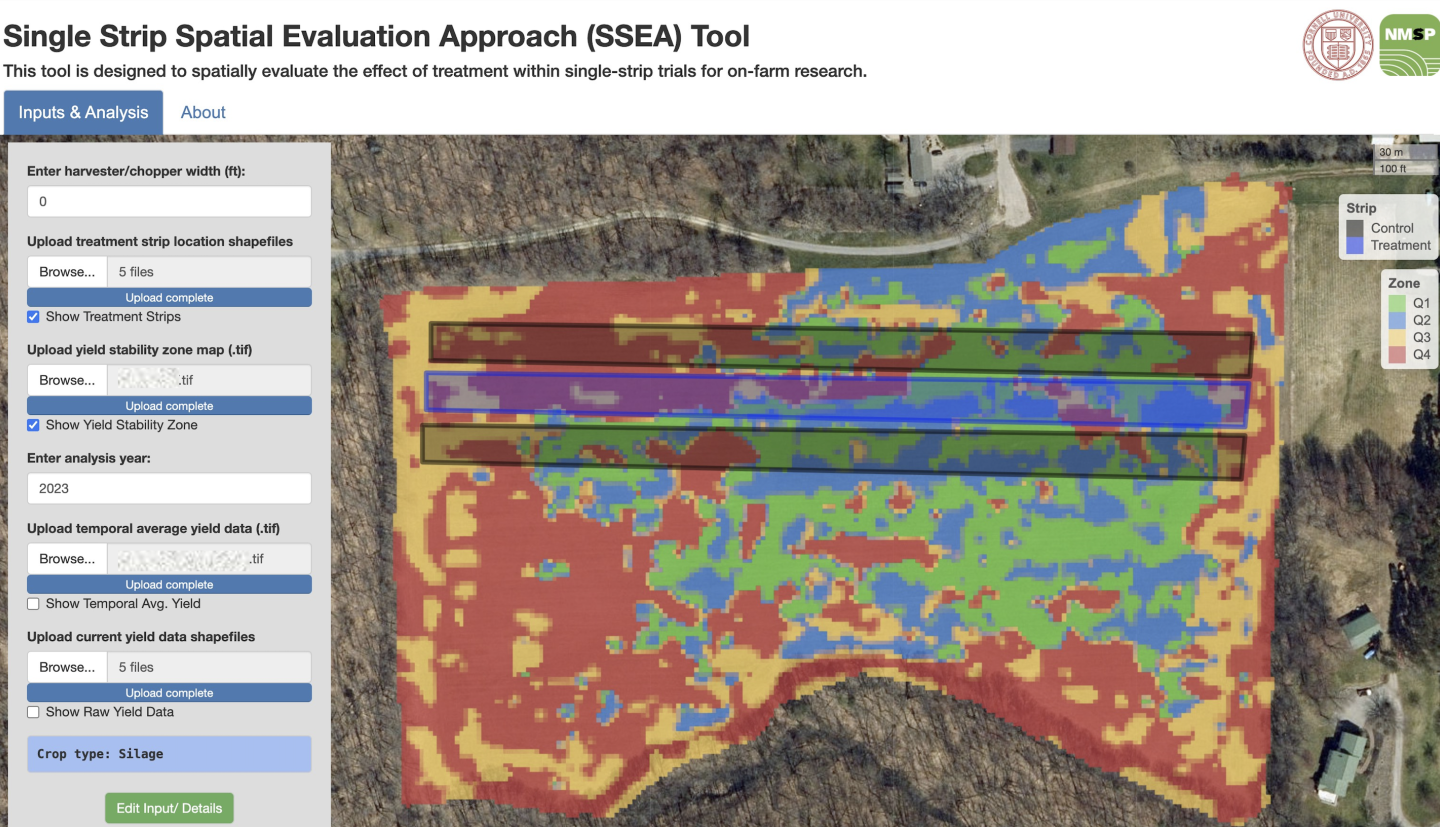
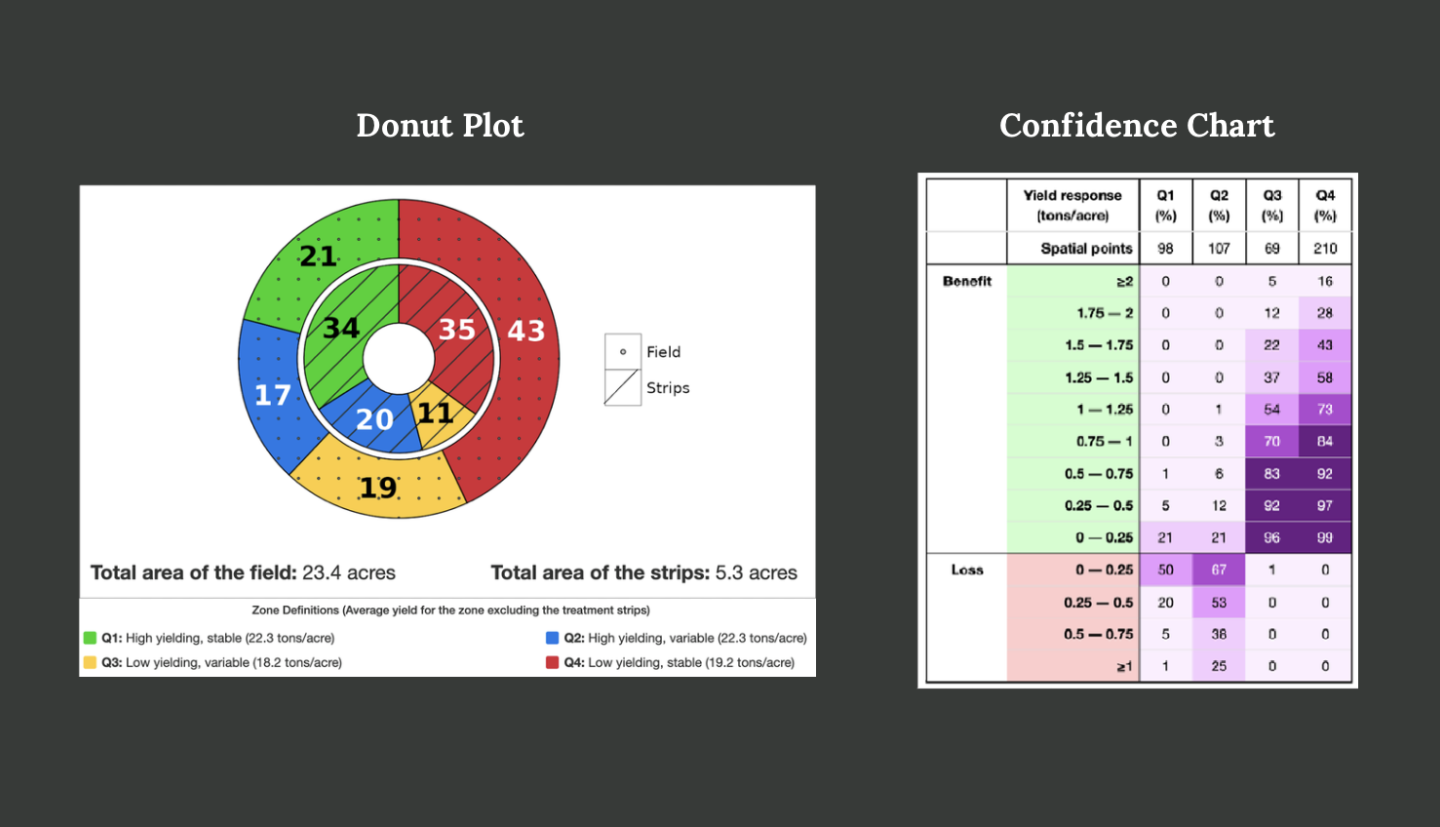
One of the best ways to connect science to practice is through on-farm research. On-farm research can help farmers make informed decisions about how to efficiently use their resources (like fertilizer and seed) to grow high-yielding, high-quality crops. However, traditional research designs like replicated strip trials can be difficult to implement because of the time, equipment and labor required during the busy growing season. Consequently, farmers can now use the Single-strip Spatial Evaluation Approach (SSEA) for on-farm research because of its simple, straightforward approach that fits within normal farm operations.
Keep Exploring
Field Note
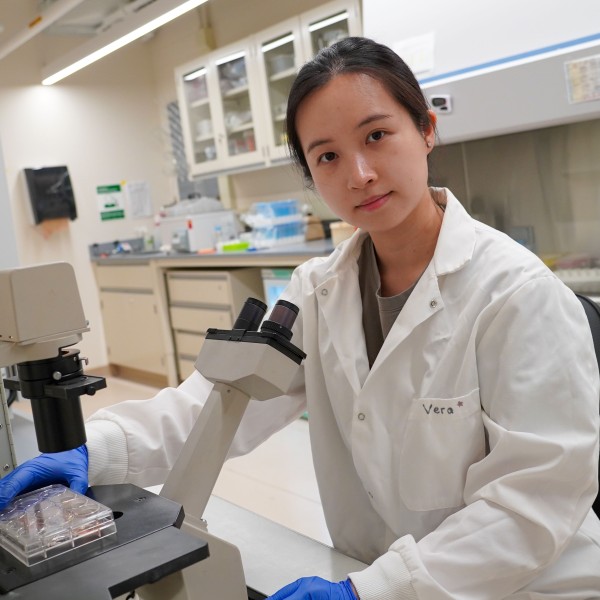
Xingtan (Vera) Yu PhD’27 is a doctoral student working in the lab of Jingyue (Ellie) Duan , assistant professor of functional genomics. Vera’s research focuses on the effects of heat stress on the mammary gland of the dairy cow. We spoke to her...


We openly share valuable knowledge.
Sign up for more insights, discoveries and solutions.
Please enter a valid email address to subscribe to the newsletter.